



If your shipping line has felt heavier the last few weeks, you're not imagining it. Late August and early September brought a fresh round of fuel and peak-season surcharge updates from the major U.S. carriers, and the timing couldn't be worse — right as volume climbs into the fall shipping season. Reuters reported that Middle East supply shocks and higher transport fuel prices are driving up carrier surcharges while carrier profits hold steady, which tells you these fees aren't going away quietly.
For a large shipper with a rate desk, this is Tuesday. For a 12-person business shipping a few hundred packages a week, it's a quiet margin leak that shows up three weeks later when the shipping expense line looks 15% higher than budget and nobody can explain why.
This post isn't about the geopolitics. It's about what a carrier surcharges reforecast actually looks like when you have a small team, thin SKU margins, and no time to rebuild your whole budget model.
Why surcharges break your forecast differently than base rate hikes
Most small finance teams miss this: a base rate increase is annoying but predictable. Carriers announce it, you update your rate card, you move on. Surcharges are a different animal because they're variable, layered, and often invisible at the SKU level.
Fuel surcharges float. They reset weekly or monthly based on an index, so the number you modeled in July is already stale. Demand and peak-season surcharges stack on top — and they're frequently tied to package characteristics you don't track cleanly, like dimensional weight, residential delivery, or additional handling. FedEx publishes its demand surcharge schedule with specific date windows, and if you actually read it, you'll notice the fees aren't flat — they change by service level and by week.
The practical result: your shipping cost per order stops being a stable number. And when the input variable moves around, any forecast built on a single "average shipping cost" assumption quietly falls apart.
What tends to happen across a lot of small operations is that the shipping line in the budget gets treated as one blended figure — something like "shipping = 8% of revenue." That works fine until surcharges spike, because a blended percentage hides which orders are actually bleeding.
The deeper problem: you can't reforecast what you can't see
Before you touch a spreadsheet, sit with the uncomfortable part. Most surcharge pain isn't a pricing problem — it's a visibility problem.
Stop losing track of your business spending.
Costyly helps you record, monitor & control expenses—accurately and efficiently.
- Automated expense categorization
- Real-time budget tracking
- Detailed financial reports
No credit card required
A typical scenario looks like this. A business ships roughly 900 packages a month across FedEx and UPS. Their accounting captures the total carrier invoice as one lump expense. When surcharges rose, the total jumped about $2,600 that month. The owner assumed volume was up. Volume was actually flat — the increase was entirely fuel and residential surcharges on a subset of heavier, ship-to-home orders.
They spent two weeks debating whether to raise prices before anyone figured out which orders were the problem. That's the real cost of poor visibility: not the surcharge itself, but the delay and the wrong decisions made in the fog.
If your expense data lands as carrier-level totals instead of order-level or SKU-level detail, your reforecast is guesswork. Fixing that is step one — and it connects directly to the broader work of turning messy shipping data into usable numbers, which we covered in our guide on how to reforecast inventory, shipping and expense budgets after supply-chain disruptions. Same discipline, different trigger.
The 7-step carrier surcharges reforecast
This is built for speed. You should be able to run the first pass in an afternoon and refine it over a week — not stand up a three-month FP&A project.
-
Pull 90 days of line-item carrier invoices, not summaries. You need the actual surcharge breakdown per shipment — fuel, residential, additional handling, dimensional adjustments. If your carrier portal exports it, great. If not, request the detailed billing file. This is the single most important step and the one most teams skip.
-
Separate base cost from surcharge cost. Build two columns. You want to know your true "controllable" shipping cost versus the floating surcharge layer. In most small operations, surcharges now run somewhere between 18% and 35% of the total carrier bill — and people are consistently shocked when they see it isolated.
-
Map surcharge exposure by order type. Group by whatever drives the fees: residential vs. commercial, package weight bands, service level, zone. You're looking for the 20% of order types generating 60%+ of the surcharge dollars.
-
Re-run your gross margin at the SKU level. For thinly priced items, add the actual per-order surcharge, not the blended average. This is where you'll find SKUs quietly selling at a loss.
-
Model three surcharge scenarios. Don't forecast a single number. Build low, expected, and high cases based on how much further fuel surcharges could climb. Peak-season fees have published end dates — use them to model the roll-off too.
-
Set trigger-based actions, not one-time decisions. Decide in advance: "If surcharges exceed X per order on this SKU group, we adjust price or shipping method." Triggers beat panic.
-
Rebuild your shipping budget line as a rate × mix formula. Replace "8% of revenue" with (base rate × volume) + (surcharge rate × exposed volume). This makes future spikes automatically flow through your forecast instead of blindsiding you.
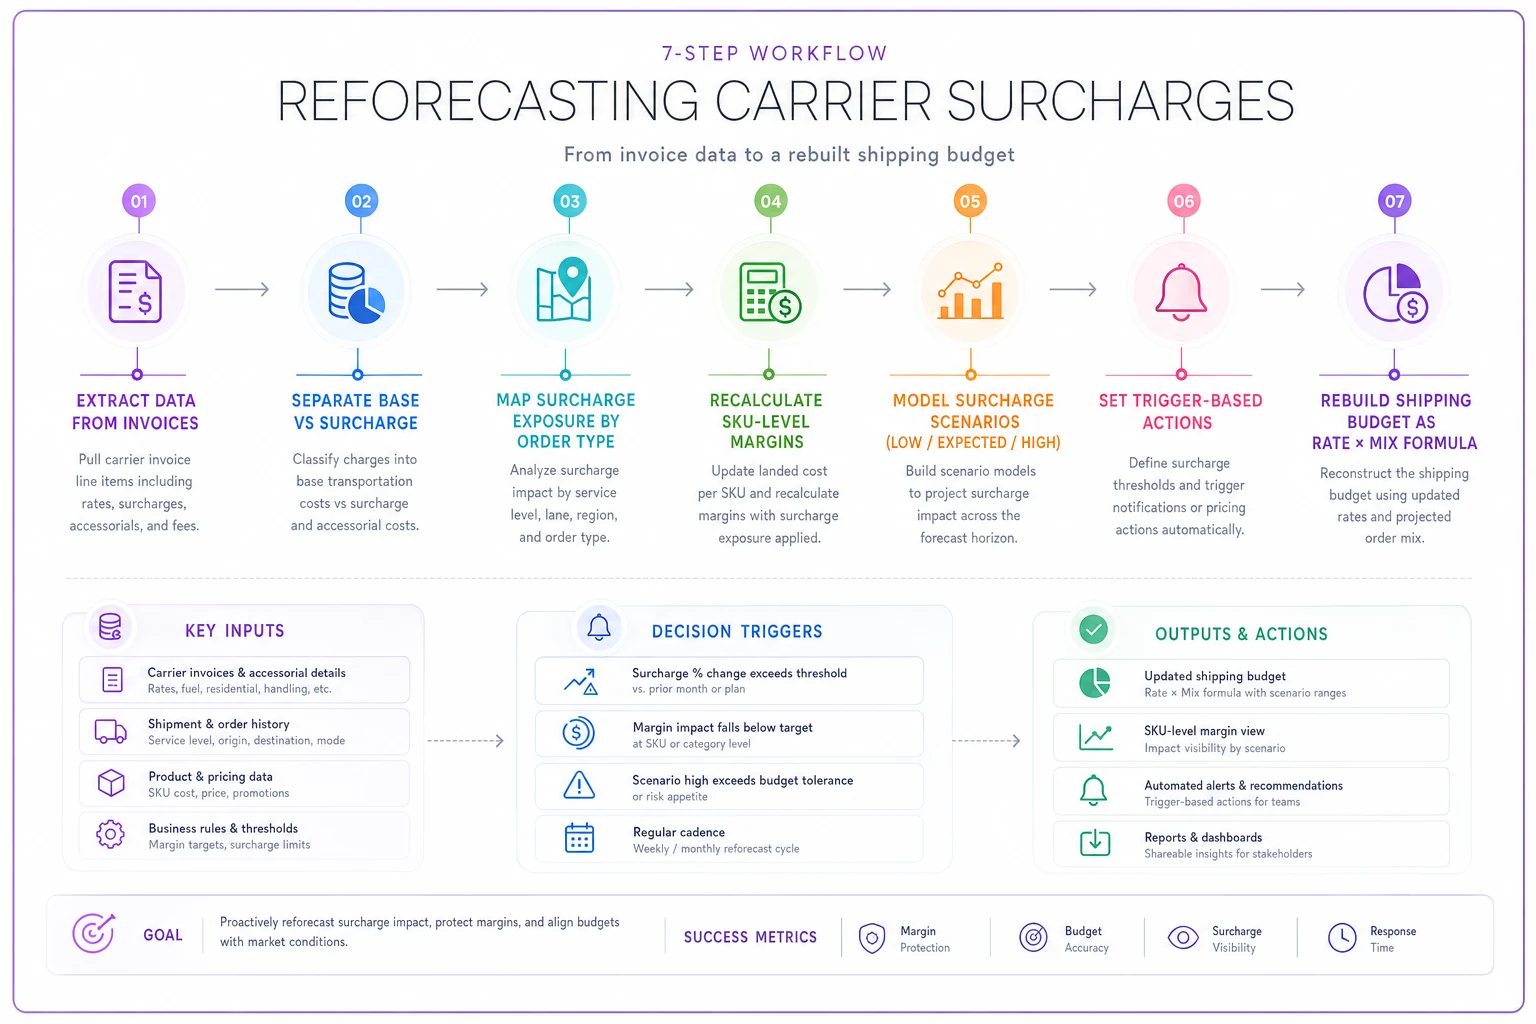
Use this visual as a quick checklist while you run the steps.
A quick way to see where the money actually goes
Once you've split base cost from surcharge cost, a simple breakdown table exposes the problem faster than any narrative. Here's the kind of view worth building for your top order types:
| Order type | Avg base ship cost | Avg surcharge | Surcharge % of total | Margin impact |
|---|---|---|---|---|
| Commercial, light | $7.20 | $1.10 | ~13% | Minimal |
| Residential, light | $8.40 | $2.85 | ~25% | Moderate |
| Residential, heavy | $12.90 | $6.40 | ~33% | Severe on low-price SKUs |
| Oversized / DIM | $14.50 | $9.20 | ~39% | Losing money on some SKUs |
The pattern almost always looks like this: your commercial and light orders are fine, and a specific cluster of heavy or oversized residential shipments is eating the margin. You don't need to raise prices across the board. You need to fix that cluster.
Where the manual approach falls apart
Running this once is doable by hand. Running it every month as surcharges keep floating is where small teams burn out.
The failure pattern is predictable. Someone exports the carrier file, spends half a day categorizing shipments in a spreadsheet, updates the model, and then doesn't do it again next month because it's tedious. Two months later the forecast is stale and the surcharge creep is back, unnoticed.
Automate classification so the reforecast becomes a routine dashboard rather than a monthly spreadsheet project.
The honest case for having your expense tooling do the categorization automatically. When shipping charges flow in and get tagged by carrier, service level, and surcharge type without someone hand-sorting rows, the reforecast stops being a project and becomes a dashboard you glance at. Operational platforms that use automation to classify and split these line items don't make the strategic decisions for you — but they remove the grunt work that causes teams to stop looking. And when you stop looking is exactly when surcharges do the most damage.
The point isn't the tooling for its own sake. It's that surcharge tracking has to be low-friction or it won't get done, and undone tracking is how a 3% margin quietly becomes a 1% margin.
A real scenario: the home-goods seller
A small home-goods e-commerce business — around 1,100 orders a month, roughly $95k–$110k in monthly revenue — noticed margins slipping through late summer. Nothing dramatic, just a couple of points off plan.
When they split out surcharges, the story got clear fast. Their bestselling item, a mid-weight decor piece priced at $34, shipped almost entirely residential and frequently triggered additional handling fees. The blended shipping assumption said each order cost about $9 to ship. The actual loaded cost, with fuel and handling surcharges, was closer to $13.50 on that SKU.
At that price point they were netting almost nothing on their top seller, and volume was masking it. Their fix wasn't a price hike across the catalog. They raised that one SKU by $4, nudged a handful of borderline items into free-shipping thresholds that pushed average order value up, and rerouted a few oversized products to a cheaper regional service. Within two months the shipping line came back roughly in line with plan — no dramatic revenue jump, just the leak sealed.
When a full reforecast makes sense — and when it doesn't
Worth doing when: shipping is a meaningful chunk of your COGS (say, north of 6–7% of revenue), you sell physical products with tight margins, or a noticeable share of your volume is residential or heavy. If surcharges can swing your margin by more than a point, you need the visibility.
Probably overkill when: shipping is a small, stable cost, you pass freight directly to customers at cost, or your margins are fat enough that a surcharge bump is a rounding error. Don't build a three-scenario model for a problem worth a few hundred dollars a quarter.
Who should be careful here: businesses that react by immediately raising all prices. Surcharge pain is almost never spread evenly across your catalog. Blanket price hikes punish your healthy SKUs and can cost you volume, while the actual problem — that cluster of heavy residential orders — stays unaddressed. Precision beats blunt force.
The mindset shift worth keeping
Carriers will keep adjusting fees as fuel prices move. That's not a crisis to solve once; it's a condition to manage on an ongoing basis. The businesses that handle this well aren't the ones with the best forecasts — they're the ones with the fastest forecasts, who can see a surcharge shift at the SKU level and act before it compounds across a full quarter.
Build the visibility once, wire your budget line as a rate-times-mix formula instead of a flat percentage, and set your triggers in advance. Do that, and the next surcharge announcement becomes a five-minute check instead of a month-end mystery. The fees are out of your control. Whether they quietly erode your margin is entirely in it.
Carriers will keep adjusting fees as fuel prices move. That's not a crisis to solve once; it's a condition to manage on an ongoing basis. The businesses that handle this well aren't the ones with the best forecasts — they're the ones with the fastest forecasts, who can see a surcharge shift at the SKU level and act before it compounds across a full quarter.
Build the visibility once, wire your budget line as a rate-times-mix formula instead of a flat percentage, and set your triggers in advance. Do that, and the next surcharge announcement becomes a five-minute check instead of a month-end mystery. The fees are out of your control. Whether they quietly erode your margin is entirely in it.
Ready to master your business expenses?
Join 5,000+ businesses using Costyly to save time, reduce overspending, and improve financial visibility.