

Most small businesses treat carbon reporting like a problem for the future, or a problem for companies ten times their size. Then a big customer sends a supplier questionnaire, a bank asks about climate exposure for a loan renewal, or a procurement team says "we need your Scope 3 estimate before we sign." Suddenly a 15-person company is being asked to produce emissions data it has never tracked, and the finance person is staring at a spreadsheet wondering where to even start.
What gets missed in that moment: you don't need new data. You already generate a near-complete emissions signal every month. It's sitting in your expense and AP systems. Every vendor payment, every card transaction, every reimbursed fuel receipt is a proxy for something physical that happened — fuel burned, goods manufactured, servers running, flights taken. The gap isn't data collection. It's that nobody wired the carbon meaning into the spend you're already capturing.
This article is about building that wiring in a way that actually fits an SMB: practical capture rules, the minimum metadata you need, how to map spend to emissions without a PhD, and how to keep the whole thing lightweight enough that it survives past the first quarter.
Why spend is a better starting point than activity data for small teams
The "proper" way to measure emissions is activity-based: liters of diesel, kilowatt-hours consumed, kilograms of material purchased. More accurate, yes. Also completely unrealistic for a business that doesn't have meters, telematics, or a procurement system tracking physical quantities.
Spend-based estimation flips the problem. Instead of asking "how many kWh did we use," you ask "how much did we spend on electricity, and what's the emissions factor per dollar for electricity in our region?" Multiply spend by a factor, get a defensible estimate. It's the method most SMB-scale ESG frameworks quietly rely on, because it's the only one that works when your data lives in QuickBooks and a corporate card feed.
A lot of smaller operations get paralyzed by the accuracy debate. They read that spend-based factors can be off by 20–40% for a given category and decide the whole exercise is pointless. But a management-ready report isn't a scientific audit. If your transport emissions are "roughly 18 tonnes CO2e, trending down 12% year over year," that's enough to make decisions and answer a customer questionnaire. Precision can come later, for the two or three categories that actually dominate your footprint.
The real insight: carbon reporting for SMBs should be built on the same backbone as your financial reporting, because the data is the same data. If your spend categories are messy, your carbon numbers will be messy. The two problems are the same problem.
The capture rules: get this right or everything downstream breaks
Emissions mapping is only as good as the transaction metadata feeding it. This is where most first attempts fall apart — not in the carbon math, but in the raw capture.
Stop losing track of your business spending.
Costyly helps you record, monitor & control expenses—accurately and efficiently.
- Automated expense categorization
- Real-time budget tracking
- Detailed financial reports
No credit card required
A spend-to-emissions pipeline needs very little per transaction, but what it needs, it needs consistently:
-
A clean vendor identity — so you can apply a vendor-specific factor where you have one, and a category fallback where you don't.
-
A reliable category — the single most important field. This is what determines which emissions factor gets applied.
-
The spend amount in a normalized currency — factors are usually expressed per unit of currency, so cross-border spend needs converting first.
-
A date — for trending and for applying the right year's factor.
-
An optional unit-quantity field — liters, nights, kWh — populated only where it's easy to capture.
Five fields, four of which you already have. The discipline is in keeping them clean.
In practice, the breakage usually happens at vendor identity and categorization. If "Shell," "Shell Oil 4471," and "SHELL FORECOURT LONDON" all exist as separate vendors, your fuel emissions get smeared across three buckets and two of them probably end up as "miscellaneous." That's why canonical vendor data and consistent categorization matter so much before you layer carbon on top. Getting your spend taxonomy coherent first — the kind of structure covered in designing spend categories to answer leadership questions — does double duty: it makes financial reporting cleaner and makes carbon mapping possible.
The minimal-metadata principle
Once someone gets excited about ESG, the temptation is to start demanding new fields on every expense: supplier sustainability rating, product material type, shipping mode, origin country. Don't. Every new required field drops your capture compliance and annoys the people submitting expenses.
The pattern that actually sticks: require almost nothing new, derive almost everything. You already know the vendor and the category. From those two, you can derive an emissions factor automatically. The only manual enrichment worth asking for is on the handful of high-impact, high-variance transactions — a flight, a large materials order, a shipping invoice — where a single extra field meaningfully improves the estimate.
Mapping spend to emissions: vendor and category factors
Here's the mechanical core. An emissions factor converts money (or a physical unit) into estimated CO2e. Spend-based factors look like "0.35 kg CO2e per $ of spend on office supplies." You hold a library of these, keyed by category, and apply them automatically.
Two layers worth running:
-
Category factors (the default). Every spend category maps to a default emissions factor. Air travel, ground fuel, electricity, cloud services, professional services, raw materials — each gets a per-dollar factor from a published dataset. This covers 100% of your spend with zero per-transaction effort.
-
Vendor-specific factors (the override). For vendors where you have better data — say a cloud provider that publishes carbon-per-dollar figures, or an energy supplier with a known grid mix — you override the category default with a vendor-specific factor. You only build these for your biggest or most carbon-intensive vendors. The 80/20 is brutal here: for most SMBs, five to ten vendors drive the majority of the footprint.
A simplified version of the mapping table:
| Spend category | Default factor (kg CO2e / $) | Vendor override? | Notes |
|---|---|---|---|
| Ground fuel / mileage | High | Rarely | Use unit (liters) if captured |
| Air travel | High | By airline sometimes | Enrich with distance band if easy |
| Electricity / utilities | Medium–high | Yes, by supplier | Grid mix varies a lot by region |
| Cloud / hosting | Low–medium | Yes | Many providers publish factors |
| Office supplies | Low | No | Pure category estimate is fine |
| Professional services | Very low | No | Low intensity, don't over-invest |
| Raw materials / goods | Varies widely | Yes, where material known | Usually your biggest uncertainty |
The mistake people make is spending hours perfecting the factor on office supplies — a category that might be 2% of their footprint — while leaving materials or freight on a crude default. Put your enrichment effort where the emissions actually are.
One more thing: don't invent your own factors. Pull them from a recognized public dataset and record which version you used. When a customer or auditor asks "where did this number come from," the answer "EPA/DEFRA spend-based factors, 2023 set" is credible. "Our estimate" is not.
The workflow: from transaction to ESG report
[GRAPH: Transaction-to-ESG reporting workflow — from card/bill/reimbursement intake through category assignment, factor lookup, CO2e calculation, and monthly aggregation into Scope 1/2/3 report output]
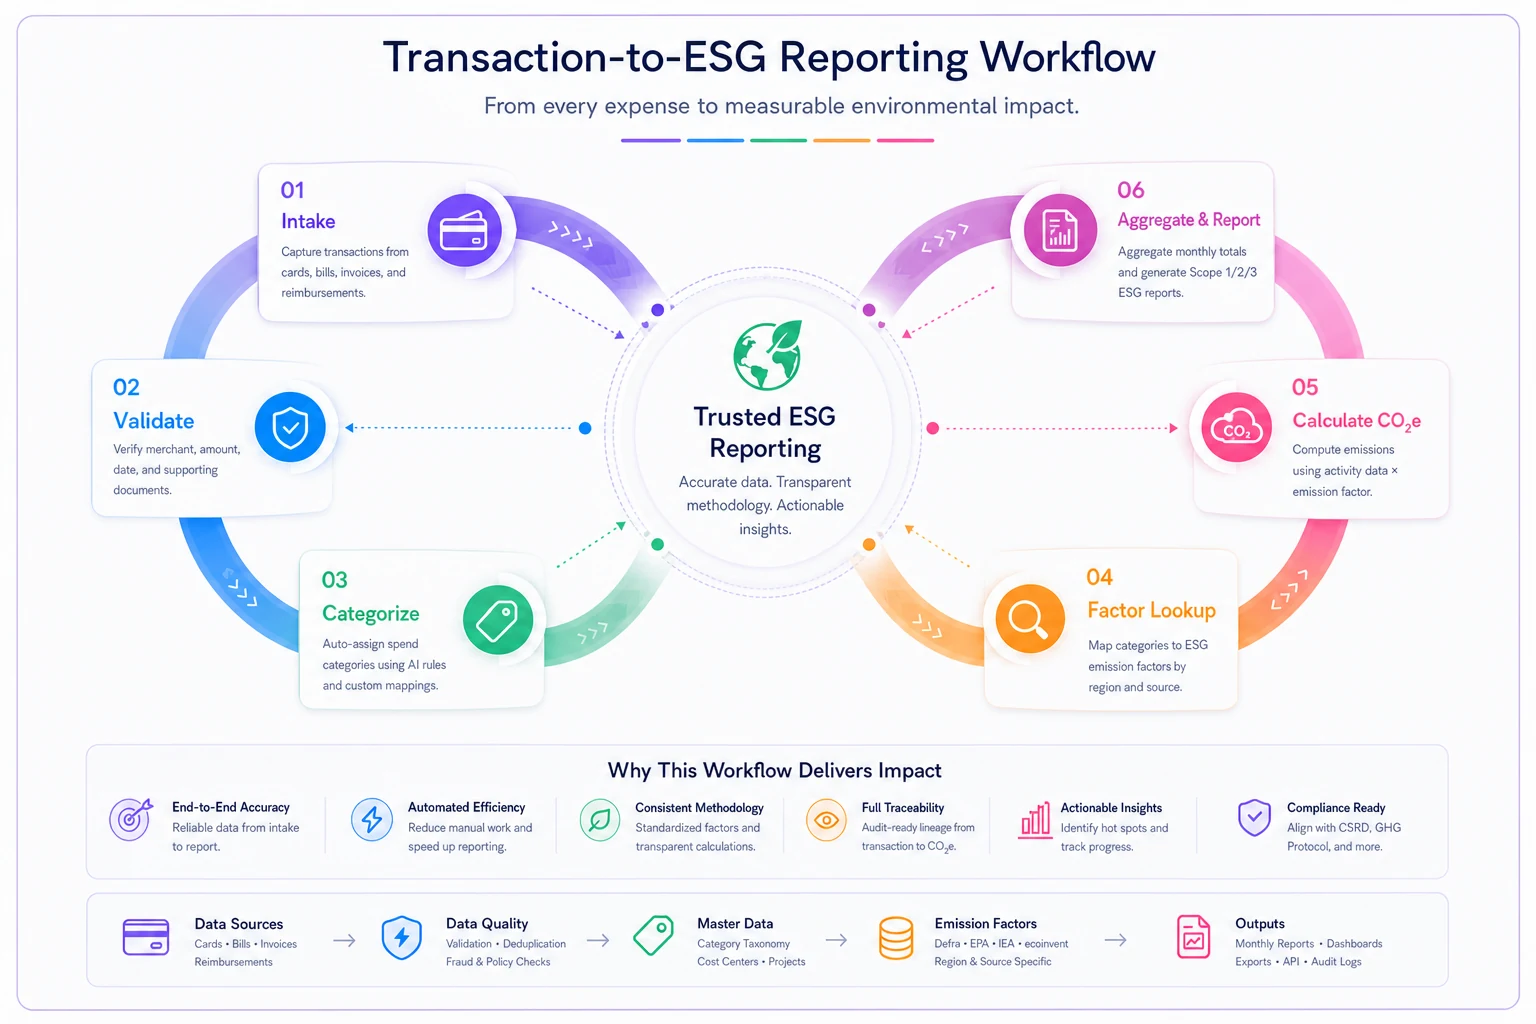
A transaction comes in — card feed, bill, or reimbursement. It gets categorized the same way it always has for accounting. That category triggers an automatic factor lookup. If the vendor has a specific override, that's applied; otherwise the category default is used. The transaction now carries an estimated CO2e value alongside its dollar value. No one typed anything extra.
At month-end, you aggregate CO2e the same way you aggregate spend — by category, by department, by cost center, by vendor. Your financial close and your carbon close become the same process, running off the same ledger. That's the whole point. You're not building a parallel system; you're adding a column.
The reporting output rolls up into the Scope framework a questionnaire or lender expects: direct fuel and facility emissions in one bucket, purchased electricity in another, and everything else — the big, messy supply-chain category — as spend-based Scope 3. For most SMBs, Scope 3 is 80–90% of the total, and it's entirely a spend-mapping exercise.
What breaks this workflow at scale isn't volume — it's category drift. As the business grows and new vendors and expense types appear, uncategorized or miscategorized transactions pile up and quietly fall out of your carbon total. This is exactly the governance problem that enforceable tag and naming conventions exist to solve. Carbon reporting just raises the stakes on housekeeping you should've been doing anyway.
Estimation templates you can reuse
For the handful of categories where a per-dollar estimate feels too crude, keep a small set of simple estimation templates rather than reaching for consultants. Rough but defensible, and consistent year over year — which is what matters for trending.
-
Air travel short-haul vs. long-haul band × number of trips × a per-band factor. You don't need exact routing; the band captures most of the variance.
-
Ground travel / fleet liters of fuel if you have receipts, otherwise mileage × a per-mile factor, otherwise spend × a fuel factor. Three tiers, use the best one available.
-
Electricity if you have kWh on the bill, use it with a regional grid factor; if not, fall back to spend × utility factor.
-
Shipping/freight weight × distance band where known, spend-based where not.
-
Home/remote work headcount × days remote × a simple per-day factor. Crude, but increasingly expected.
A consistent rough method beats an inconsistent precise one. If you estimate flights the same way every quarter, your trend is trustworthy even if the absolute number has a wide error bar. Management decisions and most reporting care far more about direction than the third significant figure.
Policy nudges that actually change behavior
Reporting carbon doesn't reduce carbon. The quiet value of embedding carbon signals into expense workflows is that it lets you nudge decisions at the moment of spend — the only moment that matters.
A few nudges that fit SMB culture without feeling heavy-handed:
-
Show the carbon figure at approval time. When a manager approves a flight or a large order, surfacing the estimated CO2e next to the dollar amount makes the tradeoff visible. No policing required — visibility alone shifts behavior.
-
Set soft thresholds, not bans. "Trips over X estimated CO2e need a one-line justification" is far more durable than a blanket travel ban, which just gets circumvented.
-
Rank vendors by intensity in your dashboards. Once leadership can see which vendors dominate the footprint, switching conversations start naturally.
This is where carbon reporting connects to management reporting you may already run. The same KPI dashboard structure managers use for spend can carry a carbon line right next to the financial ones — total CO2e, intensity per revenue dollar, trend versus last quarter. Carbon becomes just another operational metric, not a separate initiative that dies when the enthusiastic person leaves.
When this makes sense — and when it doesn't
When it makes sense: You've got a customer or lender asking, or you reasonably expect one to within a year. Your spend categories are already in decent shape. You want a repeatable estimate you can produce every quarter without a project each time. This is the sweet spot, and the setup cost is modest once your categorization is clean.
When it's premature: Your expense data is still a mess — duplicate vendors, half your transactions landing in "miscellaneous," inconsistent categories. Fix the spend foundation first. Carbon numbers built on bad categorization will be wrong in ways you can't defend, and defending them to a customer is worse than having nothing.
Who should probably not DIY this: Businesses with a genuinely carbon-intensive physical operation — manufacturing with real process emissions, heavy logistics fleets, agriculture. Spend-based estimates will understate or distort your real footprint badly enough that you need activity-based measurement for the dominant categories. Use spend-based for the long tail, but measure the physical core properly.
A real scenario
A regional design-and-fabrication shop, around 22 people, got hit with a supplier ESG questionnaire from a large retail client. They had never measured anything. The client wanted a Scope 1–3 estimate within about six weeks or they'd lose preferred-supplier status.
They didn't hire a consultant. They cleaned up their vendor list — collapsing a few dozen duplicate records into canonical vendors — confirmed their expense categories, and applied published spend-based factors across roughly 18 months of transactions. Materials and freight turned out to be close to 70% of the estimated footprint, which surprised nobody once they saw it but had never been visible before.
The whole exercise took under three weeks of part-time work from one finance person. The estimate wasn't perfect — the materials factor had a wide error band — but it was consistent, sourced, and traceable back to real transactions. It cleared the questionnaire. More useful long-term: they now produce the same report each quarter in an afternoon, because the factor mapping runs automatically off their existing categorization. Seeing freight emissions laid out next to the dollars also led them to consolidate shipments, which cut both cost and estimated CO2e by a noticeable margin over the following two quarters.
The bigger point
Carbon reporting for small businesses fails when it's treated as a separate discipline — a new system, new fields, a specialist hire. It works when it's treated as an extension of the expense and spend reporting you already do. The transactions are already flowing. The categories already exist. Adding a CO2e column is a mapping problem, not a measurement overhaul.
Get your vendor data and categorization clean, hold a small library of sourced factors, derive emissions automatically instead of demanding new inputs, and put your effort into the two or three categories that dominate. Do that, and when the questionnaire or the loan renewal or the big customer shows up, you're not scrambling — you're pulling a report that's been quietly building itself out of data you were always going to collect anyway.
Get your vendor data and categorization clean, hold a small library of sourced factors, derive emissions automatically instead of demanding new inputs, and put your effort into the two or three categories that dominate. Do that, and when the questionnaire or the loan renewal or the big customer shows up, you're not scrambling — you're pulling a report that's been quietly building itself out of data you were always going to collect anyway.
Ready to master your business expenses?
Join 5,000+ businesses using Costyly to save time, reduce overspending, and improve financial visibility.