


Most small finance teams recognize this situation but rarely name it out loud: the same metric comes out different depending on who pulls it, when they pull it, and which export they started from. Someone reports "marketing spend was $42k last quarter." A week later the number is $47k. Nobody lied. The data just isn't governed, so every report is a fresh interpretation of messy inputs.
That's not a dashboard problem. It's an operating model problem. And for teams of 5 to 20 people, it usually gets ignored until a board meeting or a bad forecast forces the issue.
An expense analytics operating model is the set of rules, ownership, and lightweight checks that make your spend numbers reproducible. Not fancier charts, not more BI seats — reproducible. The same question should always return the same answer, and when it doesn't, you should know exactly why within a few minutes.
Below is how the whole thing fits together, where it breaks as you grow, and what the pieces actually look like in practice.
The real reason spend numbers can't be trusted
Most people assume unreliable expense reporting comes from bad data entry. Sometimes it does. But the bigger culprit is usually that there's no single agreed-upon definition of anything.
Consider a mid-sized services company running QuickBooks, a corporate card platform, and a couple of spreadsheets for allocations. "Software spend" lives in at least three places:
-
The card feed, where vendor names show up as raw merchant strings like
ADOBE *ORDER 4471andAdobe Inc -
The accounting system, where someone mapped it to a GL account
-
A finance analyst's working spreadsheet, where it got re-tagged for a department view
Each of those is a slightly different version of the truth. When leadership asks "how much are we spending on software?" the answer depends on which layer you trust — and nobody wrote down the tiebreaker.
This is why the problem compounds. There's no canonical vendor registry, so Adobe, Adobe Inc, and Adobe Systems count as three vendors. There's no shared metric definition, so "monthly software spend" might or might not include annual contracts amortized across the year. And there's no freshness rule, so half the time the number is stale and nobody realizes it.
The operating model exists to kill that ambiguity — not by adding more work, but by deciding things once and enforcing them consistently.
The five layers that make spend metrics reproducible
Think of the model as five layers stacked on top of each other. Each layer feeds the next, and a failure at any layer silently corrupts everything above it.
Stop losing track of your business spending.
Costyly helps you record, monitor & control expenses—accurately and efficiently.
- Automated expense categorization
- Real-time budget tracking
- Detailed financial reports
No credit card required
| Layer | What it defines | What breaks without it |
|---|---|---|
| Canonical vendor registry | One official name + ID per vendor | Duplicate vendors, split spend, wrong totals |
| Transformation rules | How raw data becomes clean records | Inconsistent categorization, unexplainable variance |
| Metric definitions | Exact formula for each reported number | Same metric returns different values |
| Freshness SLAs | How current the data must be | Decisions made on stale numbers |
| Ownership + validation | Who's responsible and how it's tested | Errors discovered too late, no accountability |
The order matters. You can't define a clean "software spend" metric if your vendor registry is a mess, because the metric depends on knowing which line items are software vendors in the first place. Most teams try to fix reporting at the top layer — the dashboard — when the rot is two or three layers down.
Layer 1: The canonical vendor registry
This is the foundation, and it's the one teams skip most often because it feels tedious.
A canonical vendor registry is a single list where every vendor has one official name, one ID, and a set of aliases that map to it. So AMZN Mktp US, Amazon Web Services, and AWS EMEA all resolve to the same canonical entity if that's how you want them counted — or stay separate if AWS and Amazon retail purchases need different treatment.
The pattern that trips people up: the registry isn't just naming, it's decision-making. When you register a vendor, you're deciding what it is. Is Notion "software" or "productivity"? Is that consultant a vendor or a contractor for reporting purposes? Those decisions belong in the registry, made once, not re-litigated every time someone builds a report.
-
Canonical name Amazon Web Services
-
Vendor ID V-0142
-
Aliases
AWS,AMAZON WEB SERVICES,AWS EMEA SARL,AMZ*AWS -
Default category Cloud Infrastructure
-
Owner Head of Eng (budget owner)
-
Contract type Usage-based
Once this exists, categorization stops being guesswork. This connects directly to how you structure your spend taxonomy — if you haven't nailed down the categories your leadership actually asks about, it's worth reading through how to design spend categories to answer leadership questions before you lock in vendor defaults.
Layer 2: Transformation rules
Transformation rules are the documented steps that turn raw feeds into clean records. This is where "the messy card export" becomes "a categorized, deduplicated, vendor-mapped transaction."
The mistake teams make is keeping these rules in someone's head or buried in spreadsheet formulas. When that person leaves, the logic disappears and the numbers quietly drift.
Written transformation rules cover things like:
-
How merchant strings map to canonical vendors (fuzzy match, then manual review for anything under X% confidence)
-
How to handle refunds and credits (net them against the original category, don't drop them)
-
How to treat currency conversion (which rate, which date)
-
How annual contracts get amortized, if at all
-
What happens to uncategorized transactions (they go to a review queue, not silently into "Other")
A real example: a company was reporting travel spend that jumped 30% one month. The cause wasn't more travel — it was a batch of refunds from a cancelled conference that got booked as positive expenses because the transformation logic didn't handle credits. Nobody documented how refunds should flow, so each analyst guessed differently. Written rules would have caught it before anyone noticed.
Layer 3: Metric definitions
Every reported metric needs a written definition precise enough that two people computing it independently get the same answer.
> Monthly software spend = sum of all transactions where canonical vendor category = "Software" OR "Cloud Infrastructure," booked to the transaction's posting date (not invoice date), including credits as negatives, excluding intercompany transfers, for the calendar month.
Notice how many decisions are packed in there. Posting date vs. invoice date alone can swing a monthly number meaningfully. Whether credits count. Whether cloud counts as software. Each choice is defensible — the point is that it's chosen and written down, not decided fresh each time.
Metrics feel obvious until you write them down, and then you discover three people had three different mental models the whole time. That's exactly the ambiguity that made your numbers move around. If you're building a manager-facing view on top of these definitions, the expense KPI dashboard playbook covers which metrics actually drive decisions versus which just look busy.
Layer 4: Freshness SLAs
A freshness SLA is a simple promise about how current each data source is. Something like:
-
Card transactions
refreshed daily, no more than 24 hours stale
-
Accounting GL data
refreshed nightly, reconciled by day 5 of month-end
-
Vendor contract data
reviewed monthly
Without a freshness rule, nobody knows whether a number is "final" or still moving. Someone pulls a mid-month report, treats it as complete, and makes a decision on data that's missing the last week of card activity.
Every data source flowing into your reporting should follow a defined refresh cycle before it reaches any metric layer. Here's roughly how that looks in practice:
``
Raw data sources (card feeds, GL exports, contract records)
        ↓
Freshness check against SLA thresholds
        ↓
Transformation rules applied (vendor mapping, credit handling, FX)
        ↓
Canonical vendor registry lookup
        ↓
Validated, categorized transaction records
        ↓
Metric computation against written definitions
        ↓
Reported number (with last-refresh timestamp)
``
Each handoff is a checkpoint. If something fails or goes stale at step two, nothing below it should be trusted — and someone should know about it before it reaches a dashboard.
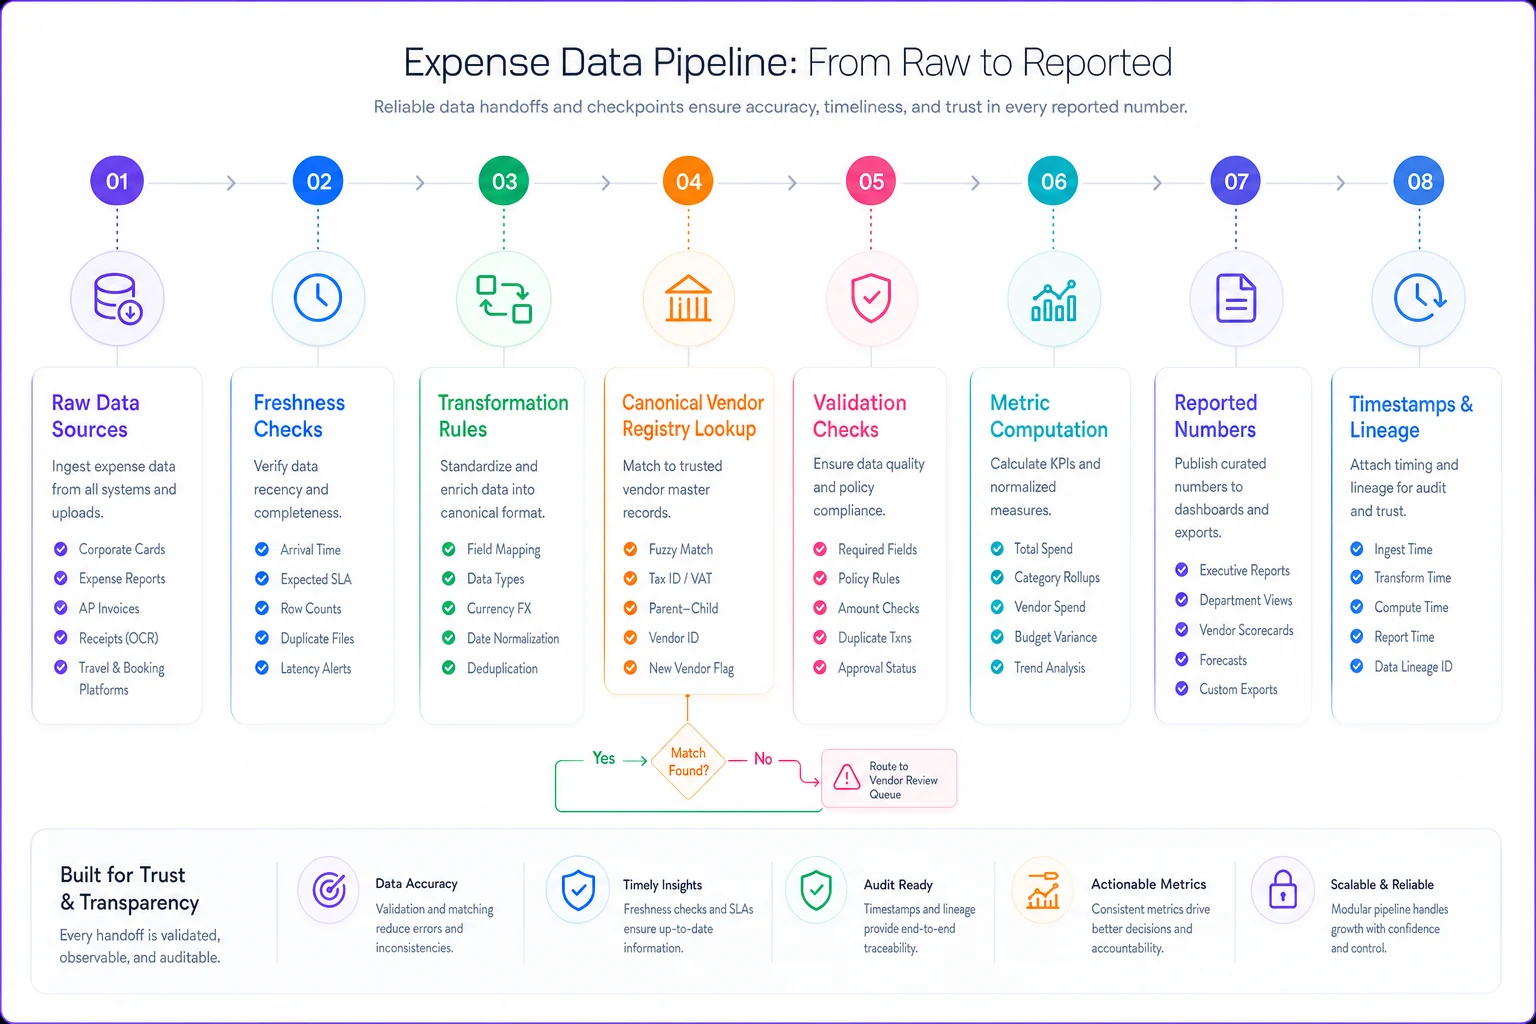
This diagram shows the handoffs and checkpoints in the freshness-to-report workflow.
Layer 5: Ownership and validation tests
The final layer is human accountability plus a small set of automated checks.
Ownership means each vendor, category, and metric has a named owner. Not "finance" — a person. When AWS spend spikes, someone specific gets the question. When the "software spend" definition needs to change, someone specific approves it.
Validation tests are lightweight checks that run automatically and flag problems before they reach a report. You don't need a data engineering team for these. A few that catch most real issues:
-
Row count sanity — transaction count is within a normal range vs. the trailing average (catches missing or double-loaded files)
-
Uncategorized threshold — flag if more than ~2% of spend is uncategorized
-
Vendor collision check — flag new merchant strings that don't map to any canonical vendor
-
Sign check — flag categories where the total flipped negative unexpectedly (usually a refund handling bug)
-
Freshness check — flag any source past its SLA
-
Duplicate transaction check — same vendor, same amount, same day appearing twice
These don't have to be sophisticated. Even six checks running on a schedule will catch the large majority of "why did the number change?" incidents before they reach a report. The real value is that variance becomes explainable instead of mysterious — and that's the whole point.
A real scenario: what this looks like when it's broken vs. fixed
A roughly 15-person marketing agency was closing books each month, but the founder never trusted the software spend figure. It bounced between about $18k and $24k month to month with no clear explanation.
Digging in, the causes were mundane:
-
Three separate "Google" vendors in their books (Google Ads, Google Workspace, and a raw
GOOGLE *SVCSthat never got mapped) — spend was split and sometimes double-counted -
Annual tool renewals hit as a single lump, so any month with a renewal looked inflated
-
Refunds from a cancelled subscription showed as positive expenses one month
-
The analyst pulling the number sometimes used a two-week-old export
None of these were dramatic on their own. Together they made the metric useless.
The fix wasn't a new tool — it was building the operating model. They created a canonical registry (Google collapsed into properly separated entities), wrote a transformation rule for refunds and renewals, defined "monthly software spend" precisely, set a 24-hour freshness SLA on the card feed, and added five validation checks.
After about two months, the monthly figure stabilized. When it moved, they could point to the reason within a few minutes instead of an afternoon. The founder stopped second-guessing the report, and month-end got about a half-day faster because the "why is this number weird" investigation basically disappeared.
The outcome that mattered wasn't a prettier dashboard. It was that a number became trustworthy enough to make decisions on.
Where this breaks as you grow
The operating model isn't static. What works at 8 people strains at 20.
At 5–10 people, one person can hold most of the registry and rules in their head, and manual review of exceptions is fine. The risk is bus factor — it all lives with one person.
At 10–15 people, spend volume and vendor count outpace manual review. Uncategorized transactions pile up, and someone's "quick fix" categorizations start contradicting the documented rules because they didn't check the doc. This is the stage where written rules and automated validation stop being optional.
At 15–20+ people, multiple people are touching the data, multiple budget owners are asking for their own cuts, and departmental views have to reconcile to the company total. Now inconsistency isn't just annoying — it's political. Two departments report numbers that don't add up to the whole, and trust erodes fast.
The pattern across this growth curve: manual coordination that works fine at small scale becomes the exact thing that breaks. The registry that lived in one head needs to become a shared source of truth. The categorization that one person did by feel needs codified rules. The validation that happened because someone "just noticed" needs to run automatically.
When to build this — and when not to
This makes sense when:
-
Your spend numbers change depending on who pulls them
-
You spend real time each month explaining variances that turn out to be data artifacts
-
Multiple people or departments need reporting that has to reconcile
-
You're making budget or hiring decisions on these numbers and can't fully trust them
This is overkill when:
-
You're a 3-person team with 20 vendors and one person who genuinely knows every transaction
-
Your spend is simple and stable enough that a clean monthly spreadsheet review actually works
-
You'd be building elaborate validation for numbers nobody uses to decide anything
Don't build the full model for its own sake. Start with the two layers that fix the most pain — usually the vendor registry and metric definitions — and add the rest as volume forces it.
Where automation quietly helps
Most of this model is decisions and documentation, which no tool can make for you. But a couple of the tedious layers benefit a lot from automation once the volume grows.
Vendor mapping is the obvious one. Matching thousands of raw merchant strings to a canonical registry by hand doesn't scale, and this is where AI-assisted matching earns its keep — resolving the easy cases automatically and routing only the uncertain ones to a human for review. The same goes for validation checks: instead of someone remembering to eyeball row counts and uncategorized totals, an operational platform can run those tests on every refresh and flag anomalies before they reach a report.
Start automating vendor mapping for frequent merchant strings and route uncertain matches to a human reviewer.
The point isn't to replace the judgment layer. It's to remove the manual grind — the string-matching, the duplicate-hunting, the "is this stale?" checking — so your team spends time on decisions that actually require a person. When the boring parts run themselves, the operating model holds together even as spend and headcount grow.
The bottom line
Unreliable spend reporting almost never comes from one broken thing. It comes from the absence of a system — no canonical vendor list, no written transformation rules, no agreed metric definitions, no freshness expectations, and no owner who gets the question when something looks off.
Build those five layers, even lightly, and something shifts. The same question starts returning the same answer. Variance becomes explainable instead of mysterious. Month-end gets faster because you stop investigating your own data. And leadership starts trusting the numbers enough to actually act on them — which, in the end, is the only reason to report them at all.
Unreliable spend reporting almost never comes from one broken thing. It comes from the absence of a system — no canonical vendor list, no written transformation rules, no agreed metric definitions, no freshness expectations, and no owner who gets the question when something looks off.
Build those five layers, even lightly, and something shifts. The same question starts returning the same answer. Variance becomes explainable instead of mysterious. Month-end gets faster because you stop investigating your own data. And leadership starts trusting the numbers enough to actually act on them — which, in the end, is the only reason to report them at all.
Ready to master your business expenses?
Join 5,000+ businesses using Costyly to save time, reduce overspending, and improve financial visibility.