

Most finance automation projects don't fail loudly. They fail quietly. A rule gets deployed, nobody tracks whether it actually helped, and six months later the team is still doing the same manual cleanup — just with an extra tool to pay for and a false sense that "we automated that."
The problem isn't the automation itself. It's that small finance teams almost never set up the experiment before turning things on. So when leadership asks "did this save us anything?", the honest answer is a shrug and a vibe. That's a terrible position to be in when you're trying to justify a renewal or decide whether to expand automation into another workflow.
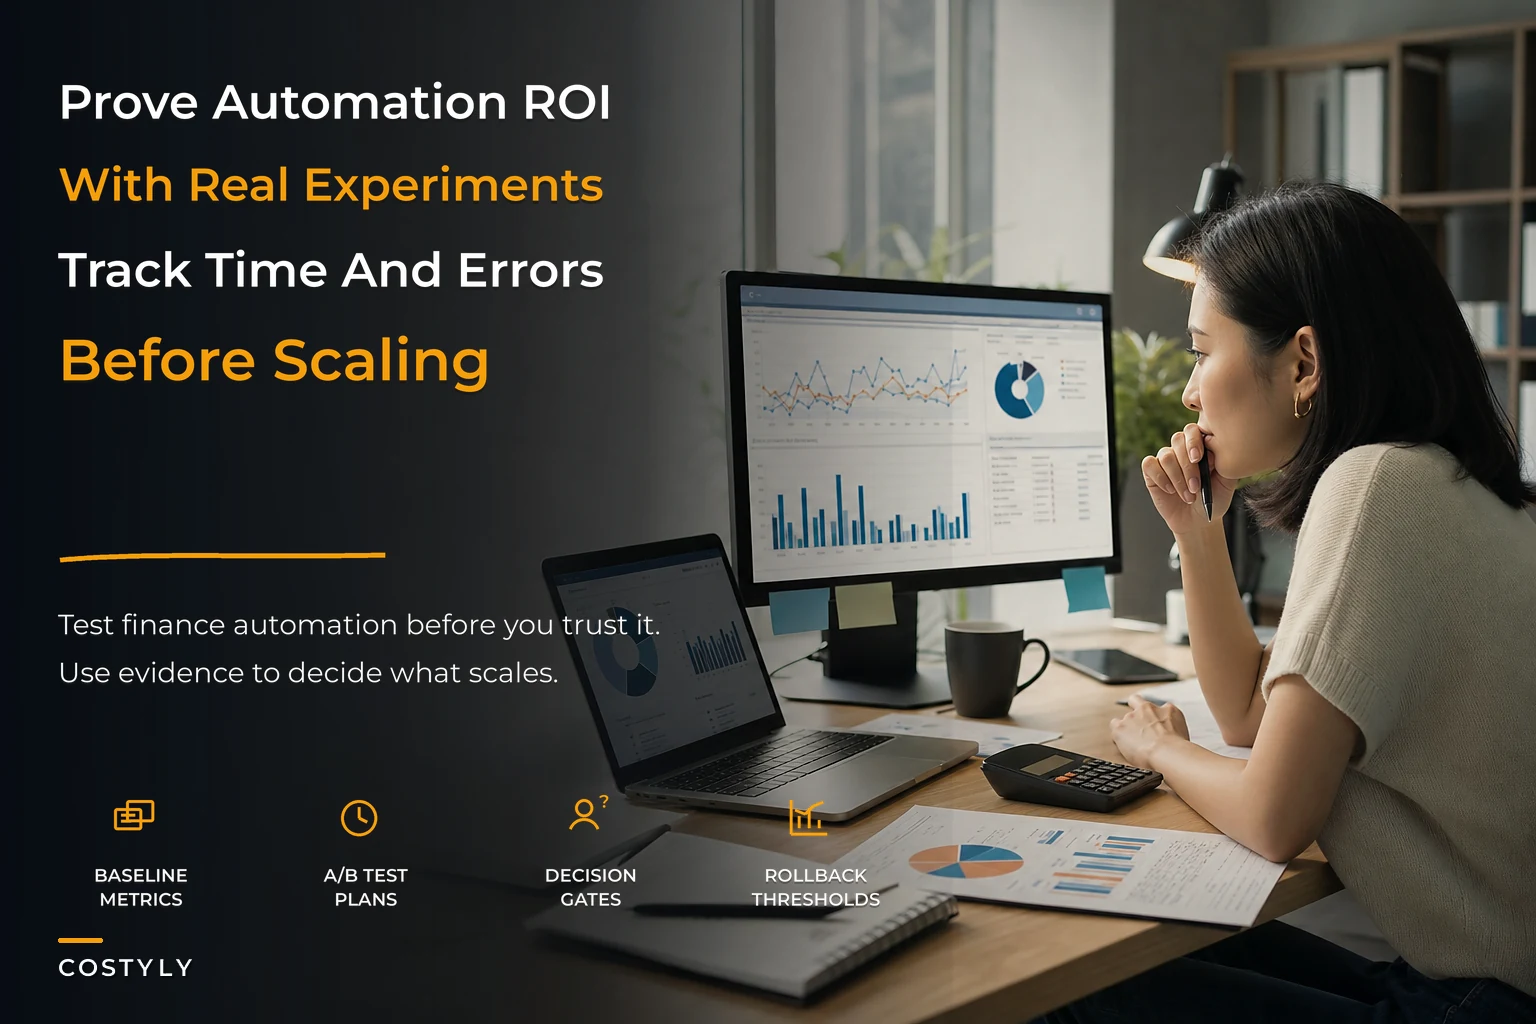
This article lays out an experiment-first approach: how to form a hypothesis, capture a real baseline, run a lightweight A/B test on a finance process, and build decision gates and rollback thresholds so you know — with actual numbers — whether an automation is earning its keep. The goal is to make finance automation ROI for SMB teams something you can prove, not something you hope for.
Why most SMB automation ROI numbers are fiction
A team buys an expense tool, enables auto-categorization and receipt matching, and the vendor's dashboard proudly reports "1,200 receipts processed automatically this month." Everyone nods. That number sounds like value.
Except processed isn't the same as correct, and correct isn't the same as saved time. If 15% of those auto-categorized transactions get reversed by your bookkeeper at month-end, you haven't saved the work — you've moved it downstream and made it harder to trace. In real operations, this usually shows up as a close that still takes the same four days it always did, even though "everything is automated now."
The deeper issue is that most teams measure activity instead of outcomes. Activity metrics (transactions touched, rules fired, emails sent) always go up when you add automation. Outcome metrics (hours of manual work, error rate, rework, cash released faster) are the only things that actually move ROI — and nobody captures them before flipping the switch.
The one habit that separates teams who know their automation ROI from teams who guess: they wrote down what "good" looked like before they changed anything.
Start with a hypothesis, not a feature
A hypothesis forces you to be specific about what you expect to change and by how much. Vague goals ("we want to be more efficient") can't be tested. Sharp hypotheses can.
Stop losing track of your business spending.
Costyly helps you record, monitor & control expenses—accurately and efficiently.
- Automated expense categorization
- Real-time budget tracking
- Detailed financial reports
No credit card required
A usable hypothesis for a finance automation has four parts:
-
The change — what you're actually turning on
-
The expected effect — which metric moves, in which direction
-
The magnitude — roughly how much
-
The guardrail — what must not get worse
> "If we auto-categorize card transactions using merchant + amount rules, we'll cut manual coding time by about 40%, without pushing our month-end reclassification rate above 5%."
Notice the guardrail. That's the part teams skip, and it's the part that saves you. Plenty of automations look great on the primary metric (time saved) while quietly wrecking a secondary one (accuracy). A hypothesis without a guardrail is just wishful thinking with a percentage attached.
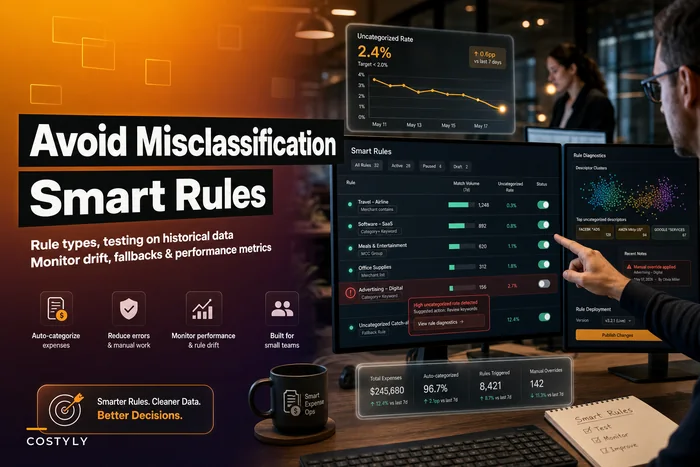
If you're building categorization rules specifically, it's worth pairing this with a maintainable rule structure so your experiment isn't testing a brittle mess — there's a full breakdown in maintainable smart rules to auto-categorize expenses that pairs well with the testing approach here.
Capture a baseline that actually means something
You can't measure improvement against a number you don't have. And yet baseline capture is where almost every small team cuts the corner, usually because it feels like busywork when you "already know" the process is slow.
The two baseline metrics that matter most for expense automations are time saved and error rate. Both are easy to measure badly.
Time. Don't ask people "how long does coding expenses take you?" You'll get an estimate that's either inflated or wildly optimistic depending on their mood. Instead, timebox a real sample. For two weeks, have whoever codes transactions log start/stop times for a batch — even rough timestamps are fine. What you want is a defensible number like "roughly 6–8 hours per week across the team on manual categorization," not a guess.
Error rate. This one needs a definition before you measure it. An error could be: a miscoded category, a wrong cost center, a duplicate, or a transaction that had to be touched more than once. Pick a definition and stick with it. A common baseline looks like "around 8–12% of transactions get reclassified or corrected after initial coding." That range is your line in the sand.
-
[ ] Defined exactly what counts as an "error" (and wrote it down)
-
[ ] Measured manual time on a real sample, not from memory
-
[ ] Captured volume (transactions/week) so you can normalize later
-
[ ] Noted who does the work (so you can value the time saved correctly)
-
[ ] Recorded current cycle time (e.g. days to close, days to reimburse)
-
[ ] Snapshot a copy of the raw data before any rule touches it
That last point matters more than it looks. If you don't preserve pre-automation data, you lose the ability to re-run the comparison later when someone inevitably questions the results.
A/B test plans built for small finance teams
The term "A/B test" scares small teams because it sounds like you need a data science function and thousands of samples. For most expense automations, you don't. You need a clean split and enough volume to tell signal from noise.
Three practical ways to split a finance automation test:
| Split method | How it works | Best for | Watch out for |
|---|---|---|---|
| Transaction split | Route a % of transactions through the automation, rest handled manually | Categorization, receipt matching, high-volume flows | Selection bias if you split by category |
| Time split | Run manual for 3 weeks, automated for 3 weeks | Low-volume processes, approvals | Seasonality, month-end distortion |
| Person/team split | One reviewer uses automation, another doesn't | Reimbursement coding, review workflows | Skill differences between people |
For most SMBs the transaction split is cleanest when volume allows it. If you process around 2,000 card transactions a month, routing a random 50% through the automation gives you roughly 1,000 in each arm — enough to see a real difference in error rate and handling time.
When volume is low (a 20-person company with a few hundred transactions a month), the time split is more realistic, but you have to control for the calendar. Never let one arm sit entirely inside month-end and the other in a quiet week — you'll measure the calendar, not the automation.
Here's a simple visual of the A/B testing workflow.
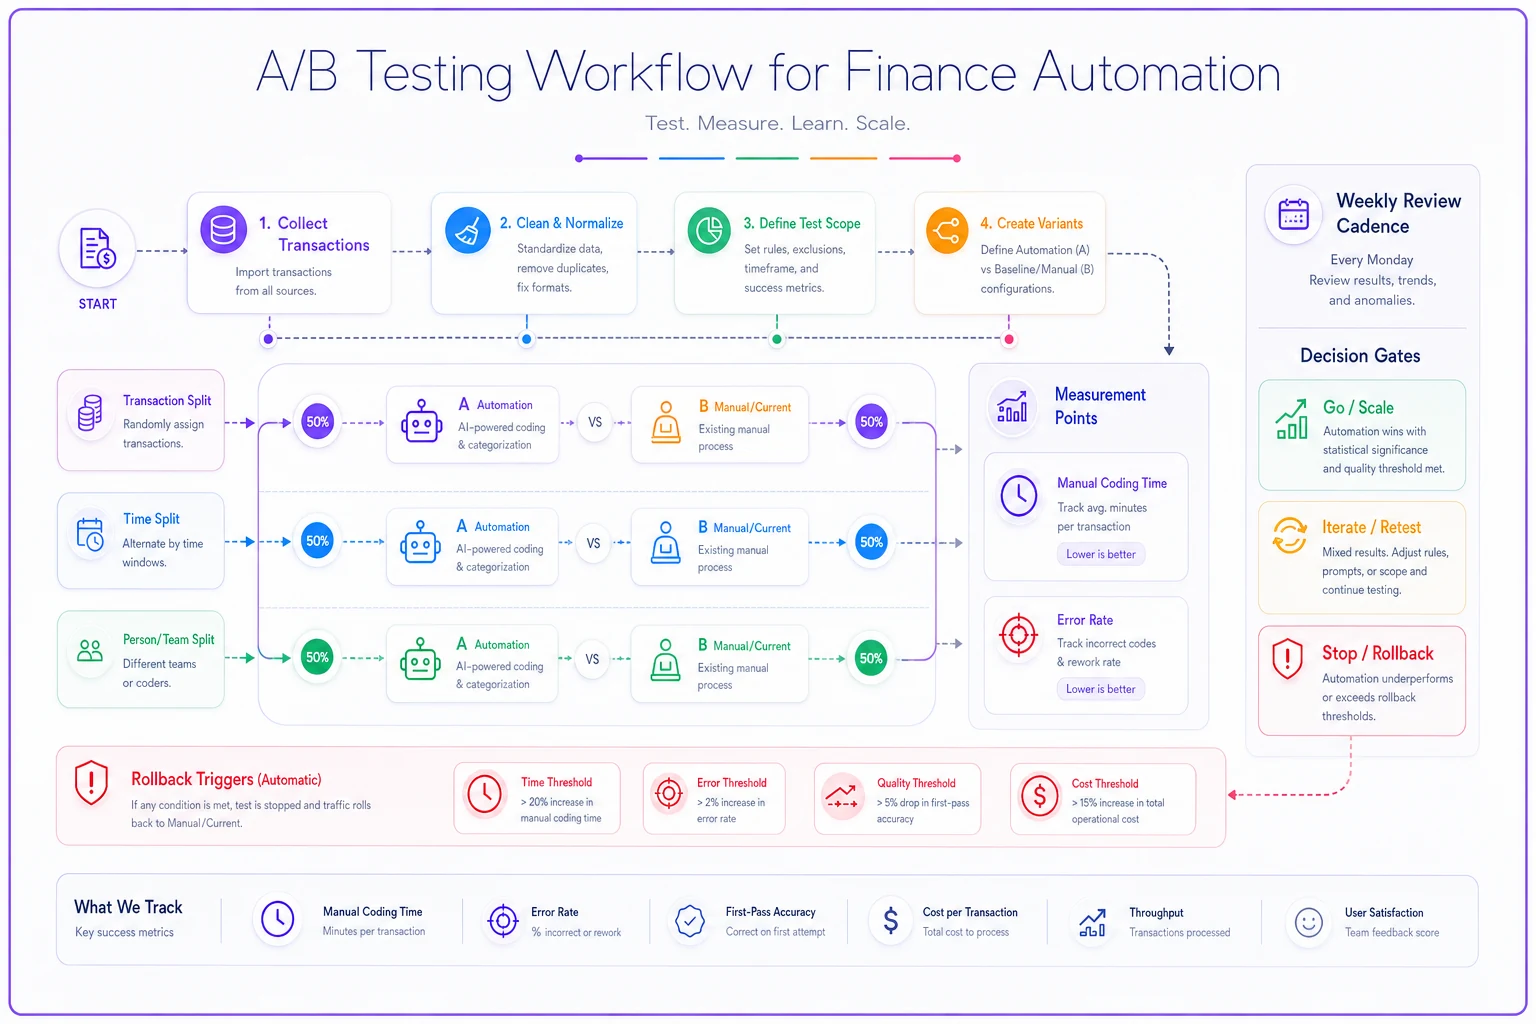
A sample A/B plan for an auto-categorization rollout:
-
Duration 4 weeks, or until each arm hits ~800 transactions, whichever comes first
-
Primary metric manual coding minutes per 100 transactions
-
Guardrail metric post-coding reclassification rate
-
Split random 50/50 transaction routing
-
Review cadence weekly check, but no decisions until the window closes
-
Who reviews same bookkeeper handles corrections in both arms, so skill is held constant
The weekly check is for catching disasters, not for calling the result early. Stopping a test the moment it looks good is one of the most common ways teams fool themselves — early noise loves to look like a trend.
Decision gates: knowing when to roll out, wait, or kill it
Once the test window closes, you need pre-agreed thresholds. Deciding what counts as "good enough" after you see the results is how motivated reasoning creeps in ("well, 3% time saved is still something, right?").
-
Green (roll out) Primary metric hit target AND guardrail stayed inside limits. Example: coding time down 35%+, reclassification rate still under 5%.
-
Yellow (iterate) Primary metric moved but missed target, OR guardrail slipped slightly. Tune the rules and re-test rather than expanding.
-
Red (roll back) Guardrail breached meaningfully, or primary metric flat or negative. The automation goes off and you don't revisit without a new hypothesis.
The yellow zone is where most SMB automations actually land, and that's fine — it means "promising but not proven." The mistake is treating yellow as green because you've already paid for the tool and don't want to admit it's not ready.
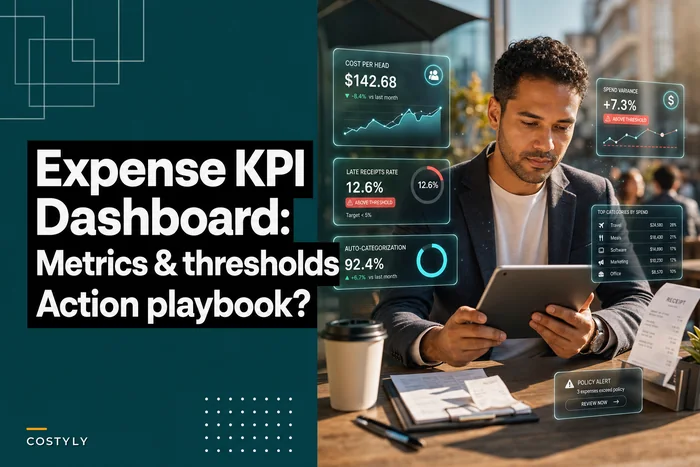
For context on which metrics belong on the dashboard you'll watch these gates against, the thresholds in an expense KPI dashboard for managers map neatly onto the guardrails above.
Rollback thresholds and why you need them before launch
Rollback is the part everyone agrees is sensible and nobody sets up in advance. Then an automation starts miscoding half the travel expenses, and because there's no pre-defined threshold, it runs for three weeks before anyone pulls it.
-
Reclassification rate climbs above 2x baseline for two consecutive weeks
-
More than 5% of auto-decisions require manual override
-
Any single category shows >20% error in automated handling
-
Close time increases versus baseline for one full cycle
Structure automations so the manual fallback is always one toggle away during the experimental phase.
The key is that a rollback should be boring to execute. If reverting means untangling a week of entries, people won't do it. Structure automations so the manual fallback is always one toggle away during the experimental phase. Keep the old process warm until the automation has cleared its decision gate — don't decommission anything on day one.
Recurring charges are a good example of where rollback discipline pays off, because errors compound silently across months. If you're testing automated matching for subscriptions and recurring vendors, the pattern-discovery approach in end manual recurring charge matching gives you something concrete to run a gated experiment against.
A real scenario: coding automation at a 25-person services firm
A professional services company with around 25 staff was spending real time on card transaction coding — roughly 7 hours a week split between a bookkeeper and an office manager, across somewhere near 1,400 monthly transactions. Their month-end reclassification rate sat around 10%, mostly because coding got rushed near close.
Before touching anything, they captured a baseline: logged two weeks of actual coding time, defined an "error" as any transaction reclassified after initial entry, and snapshotted the raw data.
The hypothesis: auto-categorization by merchant and amount would cut coding time by roughly 40% without pushing reclassification above 6%. They ran a 50/50 transaction split for four weeks.
Results were mixed — which is exactly why the gates mattered. Coding time on the automated arm dropped sharply, close to 45% less handling. But reclassification on the automated transactions crept to about 7%, just past the guardrail. That landed them in yellow, not green.
Instead of rolling out company-wide, they spent two weeks fixing the handful of merchant rules causing most of the misfires (a few vendors that sold across multiple categories), then re-tested on just those categories. Second round: reclassification settled near 4%, time savings held. Then they rolled out.
Net effect after full deployment: coding time landed around 3.5–4 hours a week, and reclassification stabilized in the 4–5% range. The important part isn't the exact numbers. It's that they can defend them, because they measured the before and gated the after.
When this experiment-first approach makes sense — and when it doesn't
This framework is worth the overhead for automations that touch volume or money in a repeatable way: categorization, receipt matching, recurring charge handling, approval routing. Anything you'll run thousands of times deserves a real test.
When it's overkill: one-off cleanups or genuinely tiny volumes. If a process happens a dozen times a year, you don't need a 50/50 split — you need someone to just do it well. Running a formal test on something that barely moves the needle wastes more time than it saves.
When it's a bad idea to skip: anything that writes directly to your books or moves cash without a human in the loop. The higher the blast radius, the more you need baselines and rollback thresholds. "We'll just see how it goes" is not a strategy for anything that affects your general ledger.
Who should hold off entirely: teams whose underlying data is a mess. If your vendor records are duplicated and your categories are inconsistent, an automation will faithfully automate the chaos. Clean the foundation first, then test — otherwise your baseline is garbage and so is every comparison you make against it.
Making the whole thing repeatable
The real payoff isn't one well-measured automation. It's turning measurement into a habit, so every new rule or workflow goes through the same loop: hypothesis, baseline, split test, gates, rollback threshold. Once that loop is normal, you stop arguing about whether automation "works" and start comparing which automations earn the most per hour of setup.
Over time this gives you something most small finance teams never build — a running record of what actually moved your numbers and what quietly didn't. That record is what lets you say no to shiny tools that don't clear the gate and yes to the boring ones that consistently save four hours a week. And when it comes to defending finance automation ROI at renewal time, having that evidence beats any vendor dashboard you'll ever be shown.
Start small. Pick one high-volume expense process, write down what "better" looks like in numbers, and measure it honestly before you change anything. The discipline feels slow the first time. By the third automation, it's just how your team works — and you'll have the receipts to prove every hour you saved.
Ready to master your business expenses?
Join 5,000+ businesses using Costyly to save time, reduce overspending, and improve financial visibility.